30 junio 2015

EL PIB mundial se ha desacelerado

Y se concentra en los mercados emergentes… Es el refugio a largo plazo para las inversiones, dado lo flojo que anda la UE y sus problemas internos y el riesgo de contagio…

World GDP

Global GDP growth was sluggish in the first three months of 2015, remaining at 2.7% year on year for a second consecutive quarter. Growth in the world economy has become increasingly reliant on just three countries: China, the United States and India were responsible for nearly 80% of global growth in the first three months of the year. The euro area’s slow recovery has continued; the 19-country bloc experienced 1.1% year-on-year growth in the first quarter of 2015 compared with 0.9% in the previous quarter. Leaving aside China and India, emerging markets struggled in the first quarter. They contributed less than 13% of global growth, the smallest proportion since late 2009.
Abrazos,
PD1: Cuánta razón tiene este gacho:

Los inversores deberían confiar en los mercados emergentes

¿Suben los tipos de interés en EEUU? Salgan de los mercados emergentes. ¿La eurozona no llega a un acuerdo con Grecia? Salgan de los mercados emergentes. ¿Problemas en algún país emergente?
Salgan inmediatamente de los mercados emergentes. Hay una creencia muy extendida según la cual, los mercados emergentes tienen un importante nivel de riesgo y volatilidad y, por tanto, están en primera línea cuando aumenta la aversión al riesgo. Así ha vuelto a ocurrir con las dudas sobre los aumentos de tipos de interés en EEUU y el estancamiento de las negociaciones con Grecia. La exposición de los inversores a los mercados emergentes se mantuvo en el mínimo de los últimos quince meses en junio, según un estudio de la gestora de fondos global de Bank of America Merrill Lynch.
Esa filosofía parece cada vez más desfasada. Desde la crisis financiera global, ha quedado demostrado que los riesgos en las economías avanzadas se habían subestimado.
Los inversores en estas economías tuvieron que aprender a familiarizarse con conceptos como el riesgo crediticio, algo bastante habitual entre sus homólogos de los mercados emergentes. El último ejemplo es el descenso de la liquidez y el aumento de la volatilidad de los mercados avanzados, características que normalmente se asociaban a los mercados emergentes. Además, en el caso de las economías emergentes, el vaso siempre suele verse medio vacío. No hay más que recordar la ralentización de su crecimiento, que, en muchos casos, fue debido a las reformas destinadas a obtener un crecimiento más sostenible. En cualquier caso, los países emergentes siguen creciendo a un ritmo más rápido que las economías desarrolladas. Según el FMI, está previsto que este año representen el 70% del crecimiento global. Un mayor problema reside en el escaso crecimiento de los países desarrollados, después de los estímulos introducidos desde que estalló la crisis. Por otra parte, en los últimos años se han anunciado ya varias crisis inminentes de las economías en desarrollo que nunca llegaron a materializarse. El secreto reside en sus regímenes cambiarios, más flexibles y en su elevado nivel de reservas. Un ejemplo de esto lo representa Rusia, que ha logrado soportar una pérdida total de acceso a los mercados financieros globales, algo que en el pasado habría tenido un mayor impacto.
En realidad, ahora que el poder de la política monetaria extraordinaria se está reduciendo, es probable que comience a mirarse con otros ojos a los mercados emergentes, rechazados durante tanto tiempo. Las valoraciones de los mercados avanzados tanto de los bonos como de las acciones son generosas; las rentabilidades parecen haber caído. Las acciones y bonos de las economías emergentes parecen mucho más atractivas en términos de rentabilidad futura, teniendo en cuenta su punto de partida. Los expertos de Pictet Asset Management pronostican unos retornos anualizados de dos dígitos de las acciones en el transcurso de esta década. Los mercados emergentes son arriesgados - pero al menos los inversores obtienen una recompensa por ese riesgo.
Es probable que un aumento de los tipos de interés de EEUU ponga a prueba a todos los mercados, después de tantos años de políticas relajadas. Y la venta instintiva de valores y bonos emergentes al primer indicio de problemas puede seguir estando vinculada al comportamiento del mercado. No obstante, es momento de que los inversores se cuestionen su validez.
PD2: No hacen más que construir infraestructuras…

Building for the Future: Infrastructure in Emerging Markets

There has been a recent debate about whether the end of the commodities “supercycle” is over, and if we are entering a new era of lower prices for natural resources, particularly oil. While no one can predict exactly where prices are headed next, one thing I do know is that demand for natural resources has continued to increase in emerging markets. Emerging economies in general have experienced stronger economic growth trends than developed markets over the past decade, a trend that I expect to continue. That growth, combined with rising populations and a trend toward urbanization, requires more infrastructure.

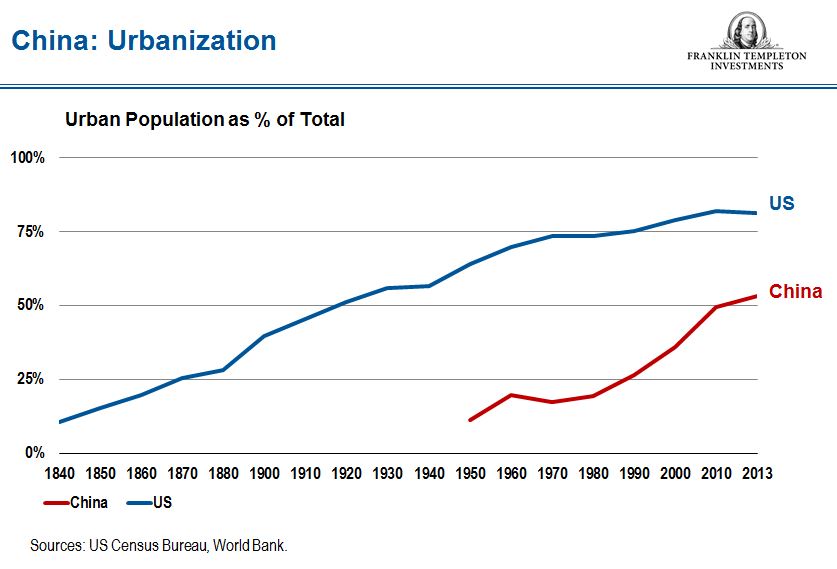
Of the 10 most populous countries in the world, eight are in emerging markets, and the emerging markets of China and India represent the largest countries in the world by population, each totaling more than one billion people.1 These people need food, clean water, energy, roads and housing. China is undergoing a trend toward urbanization, which we believe still has a ways to go and will drive the need for growth in these areas.
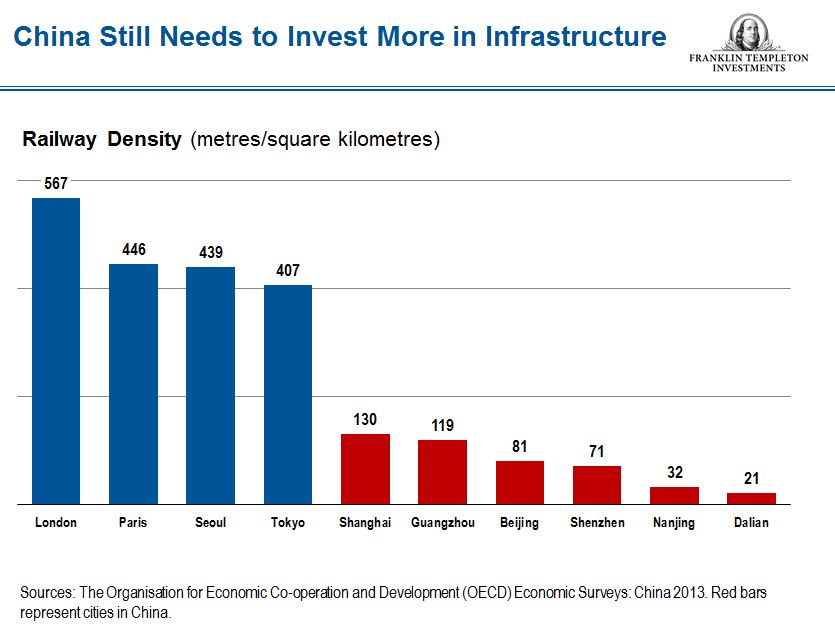
While the media has drawn attention to so-called “ghost cities” in China, claiming there has been overbuilding, visitors to China can easily see there remains a need for housing for all these new urban dwellers—and transportation to get them from place to place. The railway network in China is far more limited than that of major developed countries, even much smaller ones. China still needs to invest more in infrastructure; in our view, the game is not over. More roads are needed to accommodate the dramatically increased number of cars and trucks, while more train connections are needed to meet the rising travel demands of China’s billion people.
There certainly is a price cycle in various commodities, but I believe the demand for commodities globally should continue to increase. The price of oil is, of course, particularly volatile, but that price volatility doesn’t correlate to the movement in demand. When the price of a barrel of oil plummeted more than 25% in 2014, demand didn’t decrease by the same amount. Demand continues to increase. The US Energy Information Administration estimates that in 2014, global daily consumption of petroleum and other liquids grew by 0.9 million barrels/day to average 92.0 million barrels/day, and expects global consumption to grow by 1.3 million barrels/day in 2015 and 2016.2
Oil is not the only product in demand. In China, there has been an explosive growth in automobiles. With more gasoline-powered vehicles comes increased pollution—most of us know about the famous smog in Beijing. Catalytic converters, which contain palladium, help alleviate this pollution problem, so we expect demand for palladium should continue to rise. Incidentally, palladium is one commodity that did not suffer a decline in price in 2014 while many other commodity prices fell.
The 3rd Plenum of China’s Communist Party in 2013 announced various reforms related to infrastructure development, including private sector deregulation, resources pricing reform, and improvements in efficiency and resources allocation in state-owned enterprises. China has seen progress made in a number of key areas, as several sectors, including railways, have been opened up to private investment and the process for foreign investment approval has been simplified.
Some forecasters believe India will be growing even faster than China in the next decade. India is at what I would call the take-off stage; while gross domestic product growth has averaged about 7% over the past 10 years, I think India could be headed toward growth rates of 8%–9% in the decade ahead if reform efforts continue. Like China, India needs infrastructure.
Not only do emerging markets need infrastructure improvements, but globally, existing infrastructure in many developed regions has aged and is in need of significant repair, replacement or upgrade. A recent report from the OECD (Organisation for Economic Co-operation and Development) revealed that the pace of essential structural reforms is slowing in many advanced economies, while at the same time, many emerging economies have been recently stepping up the pace of reforms.3 This accelerated pace of reform reflects the awareness of bottlenecks and growth constraints, and the need to reduce vulnerabilities in countries more sensitive to commodity price fluctuations, the report said. We have seen how the recent drop in oil prices has helped spur reform efforts in some emerging economies that have benefited from lower prices. They, thus, have been able to take advantage of this by removing subsidies, which can be costly for governments.
Sharply rising population and increasing wealth, coupled with economic growth and urbanization trends, especially in emerging-market regions, can support the development and accelerating growth of infrastructure assets. Meanwhile, fiscal constraints and low growth rates in many large developed economies could reduce potential government infrastructure spending in developed markets over the next 20 years.
We are seeing emerging markets respond to this need for infrastructure both by reforming and expanding at home as well as seeking greater foreign investment, in many cases from other emerging markets. As part of efforts to foster stronger relations with Latin America, China’s Premier Li Keqiang visited Brazil, Colombia, Peru and Chile in May, reaching agreements on production capacity cooperation and signing more than 70 cooperative documents in energy, mining, infrastructure, and scientific and technological innovation. The establishment of a US$30 billion fund to support production capacity cooperation was also announced. China and the Eurasian Economic Union, whose members include Armenia, Belarus, Kazakhstan and Russia, also signed a joint declaration to begin working on an economic and trade cooperation deal.
In April, China’s President Xi Jinping visited the frontier market of Pakistan, where various trade, energy and infrastructure agreements were signed as part of a US$46 billion plan toward establishing a China-Pakistan Economic Corridor, a network of roads, railways and pipelines.
Indian Prime Minister Narendra Modi visited China in May where he met with President Xi Jinping and Premier Li Keqiang. In addition to cooperation agreements in sectors such as education and high-speed railways, investment agreements in renewable energy, ports and industrial parks, together worth about US$22 billion, were also signed by the two countries. Last month, Modi also announced a US$1 billion credit line to support infrastructure development in Mongolia.
We’ve also seen Brazil recently announce a new series of infrastructure projects, where roads, bridges, tunnels and a number of other projects will be privatized. Brazil has tried to privatize before, but in many cases the terms were too tough and investors were turned off by the prospects of funding unprofitable projects. Given weakness in Brazil’s economy today, the government is revising its stance and making the project offerings more attractive to investors. The winning bids will pay the government up front, which will help relieve its budget problem. I believe that with the private sector driving many of these new projects in Brazil, things will move faster and hopefully, the amount of corruption can be reduced. During Chinese Premier Li Keqiang’s trip to Brazil, more than 30 agreements worth a combined US$53 billion were signed in a number of sectors including infrastructure, trade, energy and mining.
Meanwhile, Thailand has been investing outside its borders, and is the second-largest foreign direct investor in Myanmar behind China, involved in areas from oil and gas exploration to financial services. Myanmar has also granted approvals to projects by investors in Japan, Singapore and South Korea. According to Myanmar’s Directorate of Investment and Company Administration (DICA), hundreds of companies in 38 foreign countries have so far invested more than US$55 billion in 12 sectors in Myanmar.4 We think Myanmar has the promise to become a large, dynamic market, and we see lots of potential opportunities there.
No matter where commodity prices are headed, we believe demand for infrastructure in emerging markets will likely continue. For that reason, we continue to be interested in natural resource stocks, as well as companies involved in infrastructure development.
Mark Mobius’s comments, opinions and analyses are for informational purposes only and should not be considered individual investment advice or recommendations to invest in any security or to adopt any investment strategy. Because market and economic conditions are subject to rapid change, comments, opinions and analyses are rendered as of the date of the posting and may change without notice. The material is not intended as a complete analysis of every material fact regarding any country, region, market, industry, investment or strategy.
Important Legal Information
All investments involve risks, including the possible loss of principal. Investments in foreign securities involve special risks including currency fluctuations, economic instability and political developments. Investments in emerging markets, of which frontier markets are a subset, involve heightened risks related to the same factors, in addition to those associated with these markets’ smaller size, lesser liquidity and lack of established legal, political, business and social frameworks to support securities markets. Because these frameworks are typically even less developed in frontier markets, as well as various factors including the increased potential for extreme price volatility, illiquidity, trade barriers and exchange controls, the risks associated with emerging markets are magnified in frontier markets. Stock prices fluctuate, sometimes rapidly and dramatically, due to factors affecting individual companies, particular industries or sectors, or general market conditions.
_________________________________________________________________________________________________
1. Source: World Bank, World Development Indicators database, based on 2013 data.
2. Source: US Energy Information Administration Short-Term Energy Outlook, June 7, 2015. There is no assurance that any estimate or forecast will be realized.
3. Source: OECD (2015), “Economic Policy Reforms 2015, Going for Growth,” OECD Publishing, Paris. http://dx.doi.org/10.1787/growth-2015-en
4. Source: Directorate of Investment and Company Administration (DICA), as of May 2015.
PD3: Se preparan para el futuro…
El fabricante aeronáutico europeo Airbus prevé que en 20 años la flota global de aviones de más de 100 plazas se duplicará al pasar de los 19.000 actuales a unos 38.500 gracias, sobre todo, al tirón del tráfico aéreo en los países emergentes.
En sus previsiones publicadas hoy, coincidiendo con la apertura del Salón Aeronáutico de Le Bourget, al norte de París, indicó que de aquí a 2034 el crecimiento del transporte de pasajeros por avión progresará a un ritmo medio del 4,6 % anual. Para absorber esa evolución y la renovación de flotas de las compañías, harán faltas unos 32.600 aviones de un valor de alrededor de 4,9 billones de dólares, informa Efe.
Mientras en los países desarrollados de Europa y Norteamérica el tráfico de pasajeros subirá a un 3,8 % anual, en las economías emergentes la cadencia será del 5,8 %, y una de las consecuencias será que China se convertirá en el primer mercado (por delante de EEUU) en un plazo de un decenio. Según sus estimaciones, mientras en la actualidad un 25 % de la población de los países emergentes viaja en avión al menos una vez al año, en dos décadas la proporción será del 74 %.
Megaaviones para megaciudades
Otra de las tendencias destacadas es el peso de las que el estudio llama "megaciudades" en el tráfico de larga distancia, ya que pasarán de suponer el 90 % ahora (con 900.000 pasajeros al día) al 95 % para 2034 (con 2,3 millones de pasajeros por jornada). Por eso, Airbus calcula que de los 32.600 aeronaves que se venderán en ese periodo, 9.600 serán de gran capacidad (dos o más pasillos), con un valor de unos 2,7 billones de dólares.
Esas aeronaves de gran capacidad, según sus cálculos, significarán en torno al 30 % del total de las nuevas, pero el 55 % en valor. Y ahí es donde el constructor europeo espera rentabilizar su avión gigante A380, cuyo despegue comercial está tardando en llegar más de lo programado -de hecho el programa sólo debe empezar a dar beneficios al grupo en 2015-.
En cuanto a los aparatos de un solo pasillo, que son los que por el momento representan la gran fuente de ingresos de Airbus -y de su rival estadounidense Boeing-, de aquí a 2034 se venderán unos 23.000 por un valor de 2,2 billones de dólares.
Menos optimista que Boeing
Las previsiones de Airbus son, en cualquier caso, un poco menos optimistas que las de Boeing, que la semana pasada indicó que de aquí a 2034 se comercializarán 38.050 aviones nuevos, de forma que la flota global subirá hasta 43.560. Según el grupo estadounidense, las regiones Asia-Pacífico y Oriente Medio van a tener las mayores cadencias, con una progresión del 2,7 % anual del número de aeronaves, mientras en Latinoamérica y en África el ascenso será del 2,4 %, del 1,6 % en Europa y del 1,4 % en Norteamérica.
PD4: Cuando ves una iglesia de lejos sabes que el Señor está dentro, en el Sagrario. Yo cuando paso cerca de una iglesia suelo hacer una comunión espiritual, es decir, digo en bajo que me gustaría recibirle con aquella pureza, humildad y devoción con que le recibía la Virgen. En definitiva es como comulgar, pero sin comulgar. Y se puede hacer muchas veces, tantas como iglesias pases por delante. Y mira que Madrid está lleno… Me sirve para estar más con el Señor, llevarle más dentro de mí, recuerdas, los cristianos somos unos sagrarios andantes…

29 junio 2015

demanda de energía

Nos enfrentamos a días de mucha volatilidad ya que el futuro de Grecia dentro del UE parece que toca a su fin. Corralito al canto, de lo poco que han dejado en las cuentas y, a pesar del referéndum convocado para volver a ganar tiempo, es un tema que toca ponerle un final, cuya consecuencia es un empobrecimiento de los helenos. ¿Habrá contagio en otros países periféricos? Eso es lo que está por ver…
En China también recortes fruto de las fuertes subidas que acumulaban en el último año. El inversor a largo plazo, cuyo horizonte de inversión sea de 5 años no creo que deba hacer nada en estos días de volatilidad...
Some people talk about peak energy (or oil) supply. They expect high prices and more demand than supply. Other people talk about energy demand hitting a peak many years from now, perhaps when most of us have electric cars.
Neither of these views is correct. The real situation is that we right now seem to be reaching peak energy demand through low commodity prices. I see evidence of this in the historical energy data recently updated by BP (BP Statistical Review of World Energy 2015).
Growth in world energy consumption is clearly slowing. In fact, growth in energy consumption was only 0.9% in 2014. This is far below the 2.3% growth we would expect, based on recent past patterns. In fact, energy consumption in 2012 and 2013 also grew at lower than the expected 2.3% growth rate (2012 – 1.4%; 2013 – 1.8%).
Figure 1- Resource consumption by part of the world. Canada etc. grouping also includes Norway, Australia, and South Africa. F Soviet Union means Former Soviet Union. Middle East excludes Israel. Based on BP Statistical Review of World Energy 2015 data.
Recently, I wrote that economic growth eventually runs into limits. The symptoms we should expect are similar to the patterns we have been seeing recently (Why We Have an Oversupply of Almost Everything (Oil, labor, capital, etc.)). It seems to me that the patterns in BP’s new data are also of the kind that we would expect to be seeing, if we are hitting limits that are causing low commodity prices.
One of our underlying problems is that energy costs that have risen faster than most workers’ wages since 2000. Another underlying problem has to do with globalization. Globalization provides a temporary benefit. In the last 20 years, we greatly ramped up globalization, but we are now losing the temporary benefit globalization brings. We find we again need to deal with the limits of a finite world and the constraints such a world places on growth.
Energy Consumption is Slowing in Many Parts of the World 
Many parts of the world are seeing slowing growth in energy consumption. One major example is China.
Figure 2. China’s energy consumption by fuel, based on data of BP Statistical Review of World Energy 2015.
Based on recent patterns in China, we would expect fuel consumption to be increasing by about 7.5% per year. Instead, energy consumption has slowed, with growth amounting to 4.3% in 2012; 3.7% in 2013; and 2.6% in 2014. If China was recently the growth engine of the world, it is now sputtering.
Part of China’s problem is that some of the would-be buyers of its products are not growing. Europe is a well-known example of an area with economic problems. Its consumption of energy products has been slumping since 2006.
Figure 3. European Union Energy Consumption based on BP Statistical Review of World Energy 2015 Data.
I have used the same scale (maximum = 3.5 billion metric tons of oil equivalent) on Figure 3 as I used on Figure 2 so that readers can easily compare the European’s Union’s energy consumption to that of China. When China was added to the World Trade Organization in December 2001, it used only about 60% as much energy as the European Union. In 2014, it used close to twice as much energy (1.85 times as much) as the European Union.
Another area with slumping energy demand is Japan. It consumption has been slumping since 2005. It was already well into a slump before its nuclear problems added to its other problems.
Figure 4. Japan energy consumption by fuel, based on BP Statistical Review of World Energy 2015.
A third area with slumping demand is the Former Soviet Union (FSU). The two major countries within tithe FSU with slumping demand are Russia and Ukraine.
Figure 5. Former Soviet Union energy consumption by source, based on BP Statistical Review of World Energy Data 2015.
Of course, some of the recent slumping demand of Ukraine and Russia are intended–this is what US sanctions are about. Also, low oil prices hurt the buying power of Russia. This also contributes to its declining demand, and thus its consumption.
The United States is often portrayed as the bright ray of sunshine in a world with problems. Its energy consumption is not growing very briskly either.
Figure 6. United States energy consumption by fuel, based on BP Statistical Review of World Energy 2014.
To a significant extent, the US’s slowing energy consumption is intended–more fuel-efficient cars, more fuel efficient lighting, and better insulation. But part of this reduction in the growth in energy consumption comes from outsourcing a portion of manufacturing to countries around the world, including China. Regardless of cause, and whether the result was intentional or not, the United States’ consumption is not growing very briskly. Figure 6 shows a small uptick in the US’s energy consumption since 2012. This doesn’t do much to offset slowing growth or outright declines in many other countries around the world.
Slowing Growth in Demand for Almost All Fuels
We can also look at world energy consumption by type of energy product. Here we find that growth in consumption slowed in 2014 for nearly all types of energy.
Figure 7. World energy consumption by part of the world, based on BP Statistical Review of World Energy 2015.
Looking at oil separately (Figure 8), the data indicates that for the world in total, oil consumption grew by 0.8% in 2014. This is lower than in the previous three years (1.1%, 1.2%, and 1.1% growth rates).
Figure 8. Oil consumption by part of the world, based on BP Statistical Review of World Energy 2015.
If oil producers had planned for 2014 oil consumption based on the recent past growth in oil consumption growth, they would have overshot by about 1,484 million tons of oil equivalent (MTOE), or about 324,000 barrels per day. If this entire drop in oil consumption came in the second half of 2014, the overshoot would have been about 648,000 barrels per day during that period. Thus, the mismatch we are have recently been seeing between oil consumption and supply appears to be partly related to falling demand, based on BP’s data.
(Note: The “oil” being discussed is inclusive of biofuels and natural gas liquids. I am using MTOE because MTOE puts all fuels on an energy equivalent basis. A barrel is a volume measure. Growth in barrels will be slightly different from that in MTOE because of the changing mix of liquid fuels.)
We can also look at oil consumption for the US, EU, and Japan, compared to all of the rest of the world.
Figure 9. Oil consumption divided between the (a) US, EU, and Japan, and (b) Rest of the World.
While the rest of the world is still increasing its growth in oil consumption, its rate of increase is falling–from 2.3% in 2012, to 1.6% in 2013, to 1.3% in 2014.
Figure 10 showing world coal consumption is truly amazing. Huge growth in coal use took place as globalization spread. Carbon taxes in some countries (but not others) further tended to push manufacturing to coal-intensive manufacturing locations, such as China and India.
Figure 10. World coal consumption by part of the world, based on BP Statistical Review of World Energy 2015.
Looking at the two parts of the world separately (Figure 11), we see that in the last three years, growth in coal consumption outside of US, EU, and Japan, has tapered down. This is similar to the result for world consumption of coal in total (Figure 10).
Figure 11. Coal consumption for the US, EU, and Japan separately from the Rest of the World, based on BP Statistical Review of World Energy data.
Another way of looking at fuels is in a chart that compares consumption of the various fuels side by side (Figure 12).
Figure 12. World energy consumption by fuel, showing each fuel separately, based on BP Statistical Review of World Energy 2015.
Consumption of oil, coal and natural gas are all moving on tracks that are in some sense parallel. In fact, coal and natural gas consumption have recently tapered more than oil consumption. World oil consumption grew by 0.8% in 2014; coal and natural gas consumption each grew by 0.4% in 2014.
The other three fuels are smaller. Hydroelectric had relatively slow growth in 2014. Its growth was only 2.0%, compared to a recent average of as much as 3.5%. Even with this slow growth, it raised hydroelectric energy consumption to 6.8% of world energy supply.
Nuclear electricity grew by 1.8%. This is actually a fairly large percentage gain compared to the recent shrinkage that has been taking place.
Other renewables continued to grow, but not as rapidly as in the past. The growth rate of this grouping was 12.0%, (compared to 22.4% in 2011, 18.1% in 2012, 16.5% in 2013). With the falling percentage growth rate, growth is more or less “linear”–similar amounts were added each year, rather than similar percentages. With recent growth, other renewables amounted to 2.5% of total world energy consumption in 2014.
Falling Consumption Is What We Would Expect with Lower Inflation-Adjusted Prices
People buy goods that they want or need, with one caveat: they don’t buy what they cannot afford. To a significant extent affordability is based on wages (or income levels for governments or businesses). It can also reflect the availability of credit.
We know that commodity prices of many kinds (energy, food, metals of many kinds) have been have generally been falling, on an inflation adjusted basis, for the past four years. Figure 13 shows a graph prepared by the International Monetary Fund of trends in commodity prices.
Figure 13. Charts prepared by the IMF showing trends in indices of primary commodity prices.
It stands to reason that if prices of commodities are low, while the general trend in the cost of producing these commodities is upward, there will be erosion in the amount of these products that can be purchased. (This occurs because prices are falling relative to the cost of producing the goods.) If, prior to the drop in prices, consumption of the commodity had been growing rapidly, lower prices are likely to lead to a slower rate of consumption growth. If prices drop further or stay depressed, an absolute drop in consumption may occur.
It seems to me that the lower commodity prices we have been seeing over the past four years (with a recent sharper drop for oil), likely reflect an affordability problem. This affordability problem arises because for most people, wages did not rise when energy prices rose, and the prices of commodities in general rose in the early 2000s.
For a while, the lack of affordability could be masked with a variety of programs: economic stimulus, increasing debt and Quantitative Easing. Eventually these programs reach their limits, and prices begin falling in inflation-adjusted terms. Now we are at a point where prices of oil, coal, natural gas, and uranium are all low in inflation-adjusted terms, discouraging further investment.
Commodity Exporters–Will They Be Next to Be Hit with Lower Consumption?
If the price of a commodity, say oil, is low, this is a problem for a country that exports the commodity. The big issue is likely to be tax revenue. Governments very often get a major share of their tax revenue from taxing the profits of the companies that sell the commodities, such as oil. If the price of oil, or other commodity that is exported drops, then it will be difficult for the government to collect enough tax revenue. There may be other effects as well. The company producing the commodity may cut back its production. If this happens, the exporting country is faced with another problem–laid-off workers without jobs. This adds a second need for revenue: to pay benefits to laid-off workers.
Many oil exporters currently subsidize energy and food products for their citizens. If tax revenue is low, the amount of these subsidies is likely to be reduced. With lower subsidies, citizens will buy less, reducing world demand. This reduction in demand will tend to reduce world oil (or other commodity) prices.
Even if subsidies are not involved, lower tax revenue will very often affect the projects an oil exporter can undertake. These projects might include building roads, schools, or hospitals. With fewer projects, world demand for oil and other commodities tends to drop.
The concern I have now is that with low oil prices, and low prices of other commodities, a number of countries will have to cut back their programs, in order to balance government budgets. If this happens, the effect on the world economy could be quite large. To get an idea how large it might be, let’s look again at Figure 1, recopied below.
Notice that the three “layers” in the middle are all countries whose economies are fairly closely tied to commodity exports. Arguably I could have included more countries in this category–for example, other OPEC countries could be included in this grouping. These countries are now in the “Rest of the World” category. Adding more countries to this category would make the portion of world consumption tied to countries depending on commodity exports even greater.
Figure 1- Resource consumption by part of the world. Canada etc. groupng also includes Norway, Australia, and South Africa. F Soviet Union means Former Soviet Union. Middle East excludes Israel. Based on BP Statistical Review of World Energy 2015 data.
My concern is that low commodity prices will prove to be self-perpetuating, because low commodity prices will adversely affect commodity exporters. As these countries try to fix their own problems, their own demand for commodities will drop, and this will affect world commodity prices. The total amount of commodities used by exporters is quite large. It is even larger when oil is considered by itself (see Figure 8 above).
In my view, the collapse of the Soviet Union in 1991 occurred indirectly as a result of low oil prices in the late 1980s. A person can see from Figure 1 how much the energy consumption of the Former Soviet Union fell after 1991. Of course, in such a situation exports may fall more than consumption, leading to a rise in oil prices. Ultimately, the issue becomes whether a world economy can adapt to falling oil supply, caused by the collapse of some oil exporters.
Our Economy Has No Reverse Gear
None of the issues I raise would be a problem, if our economy had a reverse gear–in other words, if it could shrink as well as grow. There are a number of things that go wrong if an economy tries to shrink:
+ Businesses find themselves with more factories than they need. They need to lay off workers and sell buildings. Profits are likely to fall. Loan covenants may be breached. There is little incentive to invest in new factories or stores.
+ There are fewer jobs available, in comparison to the number of available workers. Many drop out of the labor force or become unemployed. Wages of non-elite workers tend to stagnate, reflecting the oversupply situation.
+ The government finds it necessary to pay more benefits to the unemployed. At the same time, the government’s ability to collect taxes falls, because of the poor condition of businesses and workers.
+ Businesses in poor financial condition and workers who have been laid off tend to default on loans. This tends to put banks into poor financial condition.
+ The number of elderly and disabled tends to grow, even as the working population stagnates or falls, making the funding of pensions increasingly difficult.
+ Resale prices of homes tend to drop because there are not enough buyers.
Many have focused on a single problem area–for example, the requirement that interest be paid on debt–as being the problem preventing the economy from shrinking. It seems to me that this is not the only issue. The problem is much more fundamental. We live in a networked economy; a networked economy has only two directions available to it: (1) growth and (2) recession, which can lead to collapse.
Conclusion
What we seem to be seeing is an end to the boost that globalization gave to the world economy. Thus, world economic growth is slowing, and because of this slowed economic growth, demand for energy products is slowing. This globalization was encouraged by the Kyoto Protocol (1997). The protocol aimed to reduce carbon emissions, but because it inadvertently encouraged globalization, it tended to have the opposite effect. Adding China to the World Trade Organization in 2001 further encouraged globalization. CO2 emissions tended to grow more rapidly after those dates.
Figure 14. World CO2 emissions from fossil fuels, based on data from BP Statistical Review of World Energy 2015.
Now growth in fuel use is slowing around the world. Virtually all types of fuel are affected, as are many parts of the world. The slowing growth is associated with low fuel prices, and thus slowing demand for fuel. This is what we would expect, if the world is running into affordability problems, ultimately related to fuel prices rising faster than wages.
Globalization brings huge advantages, in the form of access to cheap energy products still in the ground. From the point of view of businesses, there is also the possibility of access to cheap labor and access to new markets for selling their goods. For long-industrialized countries, globalization also represents a workaround to inadequate local energy supplies.
The one problem with globalization is that it is not a permanent solution. This happens for several reasons:
+ A great deal of debt is needed for the new operations. At some point, this debt starts reaching limits.
+ Diminishing returns leads to higher cost of energy products. For example, later coal may need to come from more distant locations, adding to costs.
+ Wages in the newly globalized area tend to rise, negating some of the initial benefit of low wages.
+ Wages of workers in the area developed prior to globalization tend to fall because of competition with workers from parts of the world getting lower pay.
+ Pollution becomes an increasing problem in the newly globalized part of the world. China is especially concerned about this problem.
+ Eventually, more than enough factory space is built, and more than enough housing is built.
+ Demand for energy products (in terms of what workers around the world can afford) cannot keep up with production, in part because wages of many workers lag thanks to competition with low-paid workers in less-advanced countries.
It seems to me that we are reaching the limits of globalization now. This is why prices of commodities have fallen. With falling prices comes lower total consumption. Many economies are gradually moving into recession–this is what the low prices and falling rates of energy growth really mean.
It is quite possible that at some point in the not too distant future, demand (and prices) will fall further. We then will be dealing with severe worldwide recession.
In my view, low prices and low demand for commodities are what we should expect, as we reach limits of a finite world. There is widespread belief that as we reach limits, prices will rise, and energy products will become scarce. I don’t think that this combination can happen for very long in a networked economy. High energy prices tend to lead to recession, bringing down prices. Low wages and slow growth in debt also tend to bring down prices. A networked economy can work in ways that does not match our intuition; this is why many researchers fail to see understand the nature of the problem we are facing.
Abrazos,
PD1: Cuando estoy en Misa y llega la consagración, hago un acto de fe muy fuerte. El pan y el vino dejan de ser lo que son y se convierten en el Señor. Desde ese momento no les puedo quitar el ojo. Cuando comulgo sé que ese pan no es pan, sino que es Dios mismo lo que me como y se mete dentro de mí. Y le doy las gracias y le pido muchas cosas. El Espíritu Santo se queda dentro de mí el día entero y la noche…, hasta el día siguiente…